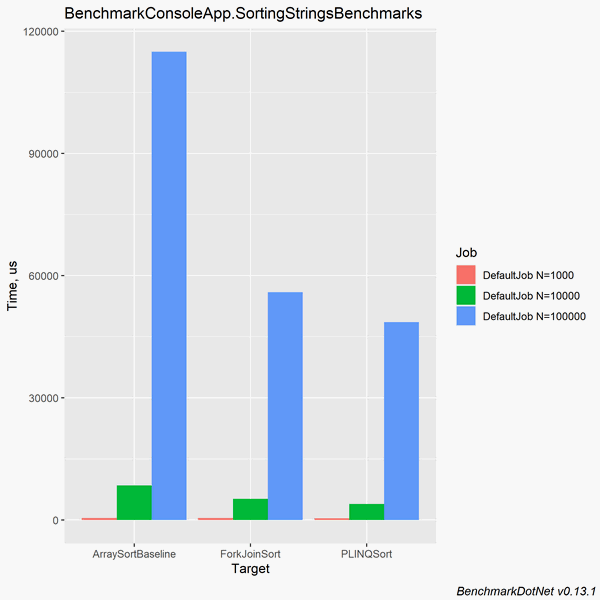
The following graph compares the execution time of three sort implementations ran against varying input sizes (1k, 10k, 100k):

This graph was generated using Benchmark.NET, which I’ll show how to use in this article. I’ll be comparing the performance of multithreaded quicksort implementations (with the non-threaded Array.Sort() as a baseline).
Table of Contents
Create console app and reference Benchmark.NET
Create a console app specifically for benchmarking. I suggest separating this console app from the code you’re benchmarking to keep things nice and organized (just like you would have a separate project for unit testing your code under test).
- Create a console app.
- Add a reference to the code you’re benchmarking.
- Install the BenchmarkDotNet package ( this is using View > Other Windows > Package Manager):
Install-Package BenchmarkDotNet
Code language: PowerShell (powershell)
At the end, your console app’s .csproj should look like this:
<Project Sdk="Microsoft.NET.Sdk">

  <PropertyGroup>
    <OutputType>Exe</OutputType>
    <TargetFramework>netcoreapp3.1</TargetFramework>
  </PropertyGroup>

  <ItemGroup>
    <PackageReference Include="BenchmarkDotNet" Version="0.13.1" />
  </ItemGroup>

  <ItemGroup>
    <ProjectReference Include="..\ThreadQuickSort\ThreadQuickSort.csproj" />
  </ItemGroup>

</Project>
Code language: HTML, XML (xml)
Note: In this example, I’m benchmarking code in a project called ThreadQuickSort.
Create benchmarks and run them
With Benchmark.NET, you create a benchmarking class. This contains one or more methods marked with the [Benchmark] attribute. When you run the benchmarks, it executes these methods. This is also where you add the benchmarking test data.
Create benchmarking class with test data
In order to compare different algorithms, it’s a good idea to benchmark them with multiple input sizes. This also gives you information about the real growth of the methods (which should match the theoretical growth determined by Big-O analysis).
The following benchmark class is configured to generate graphs to compare the performance of three sort methods (Array Sort, Fork Join Sort, and PLINQ Sort) using three input sizes: 1k, 10k, and 100k (as specified by the [Params] attribute):
using BenchmarkDotNet.Attributes;

[RPlotExporter]
public class SortingStringsBenchmarks
{
	[Params(1000, 10_000, 100_000)]
	public int N;

	private string[] copyForForkJoinSort;
	private string[] copyForPLINQSort;
	private string[] copyForBaseline;

	[GlobalSetup]
	public void GlobalSetup()
	{
		var randomArray = SortUtility.GenRandomArray<string>(size: N);
		copyForForkJoinSort = new string[N];
		copyForPLINQSort = new string[N];
		copyForBaseline = new string[N];
		Array.Copy(randomArray, copyForForkJoinSort, N);
		Array.Copy(randomArray, copyForPLINQSort, N);
		Array.Copy(randomArray, copyForBaseline, N);
	}

	[Benchmark]
	public void ForkJoinSort()
	{
	   new ForkJoinSort<string>().Sort(copyForForkJoinSort).GetAwaiter().GetResult();
	}
	[Benchmark]
	public void PLINQSort()
	{
		copyForPLINQSort = copyForPLINQSort.AsParallel().OrderBy(t => t).ToArray();
	}
	[Benchmark(Baseline = true)]
	public void ArraySortBaseline()
	{
		Array.Sort(copyForBaseline);
	}
}
Code language: C# (cs)
The method marked with the [GlobalSetup] attribute is executed once for each input size. Benchmark methods should use the same test data, and not modify the original data. This allows you to do an apples-to-apples comparison. This is why it’s generating a random array of size N and creating copies of the array for each benchmark method.
Configure and run the benchmarks
Now that you have the benchmarking class, you can run it by using BenchmarkRunner and passing in a config with the proper exporters for generating graphs.
using BenchmarkDotNet.Configs;
using BenchmarkDotNet.Exporters;
using BenchmarkDotNet.Exporters.Csv;
using BenchmarkDotNet.Running;

static void Main(string[] args)
{
	var config = ManualConfig.CreateMinimumViable();
	config.AddExporter(CsvMeasurementsExporter.Default);
	config.AddExporter(RPlotExporter.Default);

	BenchmarkRunner.Run<SortingStringsBenchmarks>(config);
}
Code language: C# (cs)
Run the benchmarks by executing the console app. This’ll start running the benchmarks and logging to the console. It’s very verbose, and it can take awhile to generate the results.
View the results
Running these benchmarks outputs the following to the console:

Note: Time is in microseconds, which appears as “us” in the console.
The benchmark results are also output to the following directory: \bin\Release\netcoreapp3.1\BenchmarkDotNet.Artifacts\results\
It ran the benchmarks with input sizes: 1k, 10k, and 100k (which were specified with the Params attribute in the benchmark class). It’s showing several statistics grouped by method name and input size. The results can be difficult to interpret in this text-based tabular format. This is where the graphs come in, as I’ll show next.
Generate graphs for comparison
Benchmark.NET generates graphs by using the R programming language to plot the results from the *-measurements.csv file. This is why you have to use the CsvMeasurementsExporter and RPlotExporter exporters in the configuration.
Install R
First, you need to install R.
- Get the latest version of R for your OS and install it. (I installed version R-4.1.1-win.exe for Windows)
- Add R’s \bin\ directory to the PATH system environment variable. (The bin directory for me was C:\Program Files\R\R-4.1.1\bin\)
- Restart Visual Studio if it was open so it gets the updated PATH variable.
If the PATH variable isn’t updated properly, you’ll see the following error when you run the benchmarks:
RPlotExporter couldn’t find Rscript.exe in your PATH and no R_HOME environment variable is defined
Benchmark.NET actually creates an R script file called BuildPlots.R in the build output directory. As long as you have the *-measurements.csv file, you can actually execute this script manually from the command line if you want. This would be useful if you don’t want to always generate the graphs every time you run the benchmarks:
RScript.exe \bin\Release\netcoreapp3.1\BenchmarkDotNet.Artifacts\results\BuildPlots.R
Code language: R (r)
Run the benchmarks and look at the graphs
Now that R is installed, re-run the benchmarks (by executing the console app).
The resulting graphs are output here: \bin\Release\netcoreapp3.1\BenchmarkDotNet.Artifacts\results\.
There are a large number of graph images. The comparison graphs are named *-barplot and *-boxplot. Take a look at the *-barplot graph:

This allows you to visually compare the different sorting methods for each input size. The PLINQ Sort method was the fastest, and it was more than 2x faster than the Array Sort method.
Include memory usage in performance comparison
It’s common to mostly look at execution time when comparing performance, but if you want the full picture, don’t forget about comparing memory usage as well.
To include memory usage stats, add the [MemoryDiagnoser] attribute to the benchmarking class:
[RPlotExporter]
[MemoryDiagnoser]
public class SortingStringsBenchmarks
{
	//rest of class
}
Code language: C# (cs)
Note: You can also add it to the config with AddDiagnoser(MemoryDiagnoser.Default).
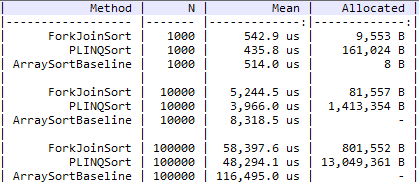
Running the benchmarks outputs the following results:

Note: Removed several columns for brevity.
The PLINQSort method is the fastest, but also uses the most memory by a significant margin (17x more than ForkJoinSort).
This shows why it’s important to comparing memory usage. It’s all about finding the appropriate balance between time and space efficiency depending on what resource constraints your software will be facing in production. Sometimes you’ll want the fastest method (PLINQSort), sometimes you’ll want the most space efficient method (ArraySortBaseline), but most of the time you’ll want to go with the balanced approach that is fast enough and relatively space efficient (ForkJoinSort).